
NHANES Accelerometry and Derivatives
NHANES Accelerometry
Waves 2011-2012 and 2013-2014
Physical Activity Data (under Examination Data)
Actigraph GT3X+, nondominant wrist


NHANES Accelerometry Data Released
Data Released in 2020 (and updated in 2022) summarized at Day/HourMinute


NHANES Summary: MIMS
Monitor-independent movement summary for accelerometer data (John et al. 2019)

New measure!
Map it back to other measures
We had a lot of research on activity counts - Intuition/cutoffs
- Used BLSA data
- older population, but still had variability
- GT3X files had been processed to Activity Counts (AC) (no open source method yet)
- Used GT3X to create MIMS (MIMSunit R Package)

Created mapping (Karas et al. 2022)

BIRS 2020: Feb 23, 2020
Almost 5 years to today!
BIRS conference: Use of Wearable and Implantable Devices in Health Research
Schedule: https://workshops.birs.ca/events/20w5109/schedule

- Waiting on Raw Data!
Recorded Videos: https://www.birs.ca/events/2020/5-day-workshops/20w5109/videos
Back from Leave of Absence
Lily Koffman - fingerprint individuals from wrist accelerometry (Lily Koffman et al. 2023)
- But need delineated walking and raw data

2022: A Number of Things Happen
- Release of NHANES Raw Data

- Release of Activity Count Algorithm and Source Code to Generate Counts (Neishabouri et al. 2022)

- OxWalk data set (S. R. Small et al. 2022)

NHANES Data Part Deux
Raw data Available
- 80Hz
- \(>\) 1Tb compressed!
- Hourly CSVs and a log file

- Tarballs of all SEQN identifiers (about 7000 per wave)

Still True Today…Mostly
John Staudenmayer from BIRS 2020:

But what if we didn’t need to “train” exactly…
Estimating Steps Raw Data
stepcount(May 25, 2021 initial commit): Scott R. Small et al. (2024)- estimate step counts from raw wrist-worn data to 10-second level
- Uses Self-Supervised Learning (unlabeled and scalable)
- Applied to UK Biobank then refined on OxWalk (S. R. Small et al. 2022)
- Performance on other datasets and compared to other open-source step counting algorithms?

Compare to Gold Standard
Lily Koffman and Muschelli (2024) estimates steps using 3 gold standard data sets: OxWalk (S. R. Small et al. 2022), MAREA (Khandelwal and Wickström 2017), and Clemson (Mattfeld, Jesch, and Hoover 2017)
- iPhone video/force sensitive resistors in shoes/ground facing gold standard

Compare to Gold Standard
Lily Koffman and Muschelli (2024) estimates steps from 5 methods on this data:

Takehome: stepcount SSL not bad
stepcount(SSL version) good for most data/metric:

Apply to NHANES
L. Koffman, Crainiceanu, and Muschelli (2024) applies those methods to NHANES.
Wildly different estimates!

Mostly similar patterns by age
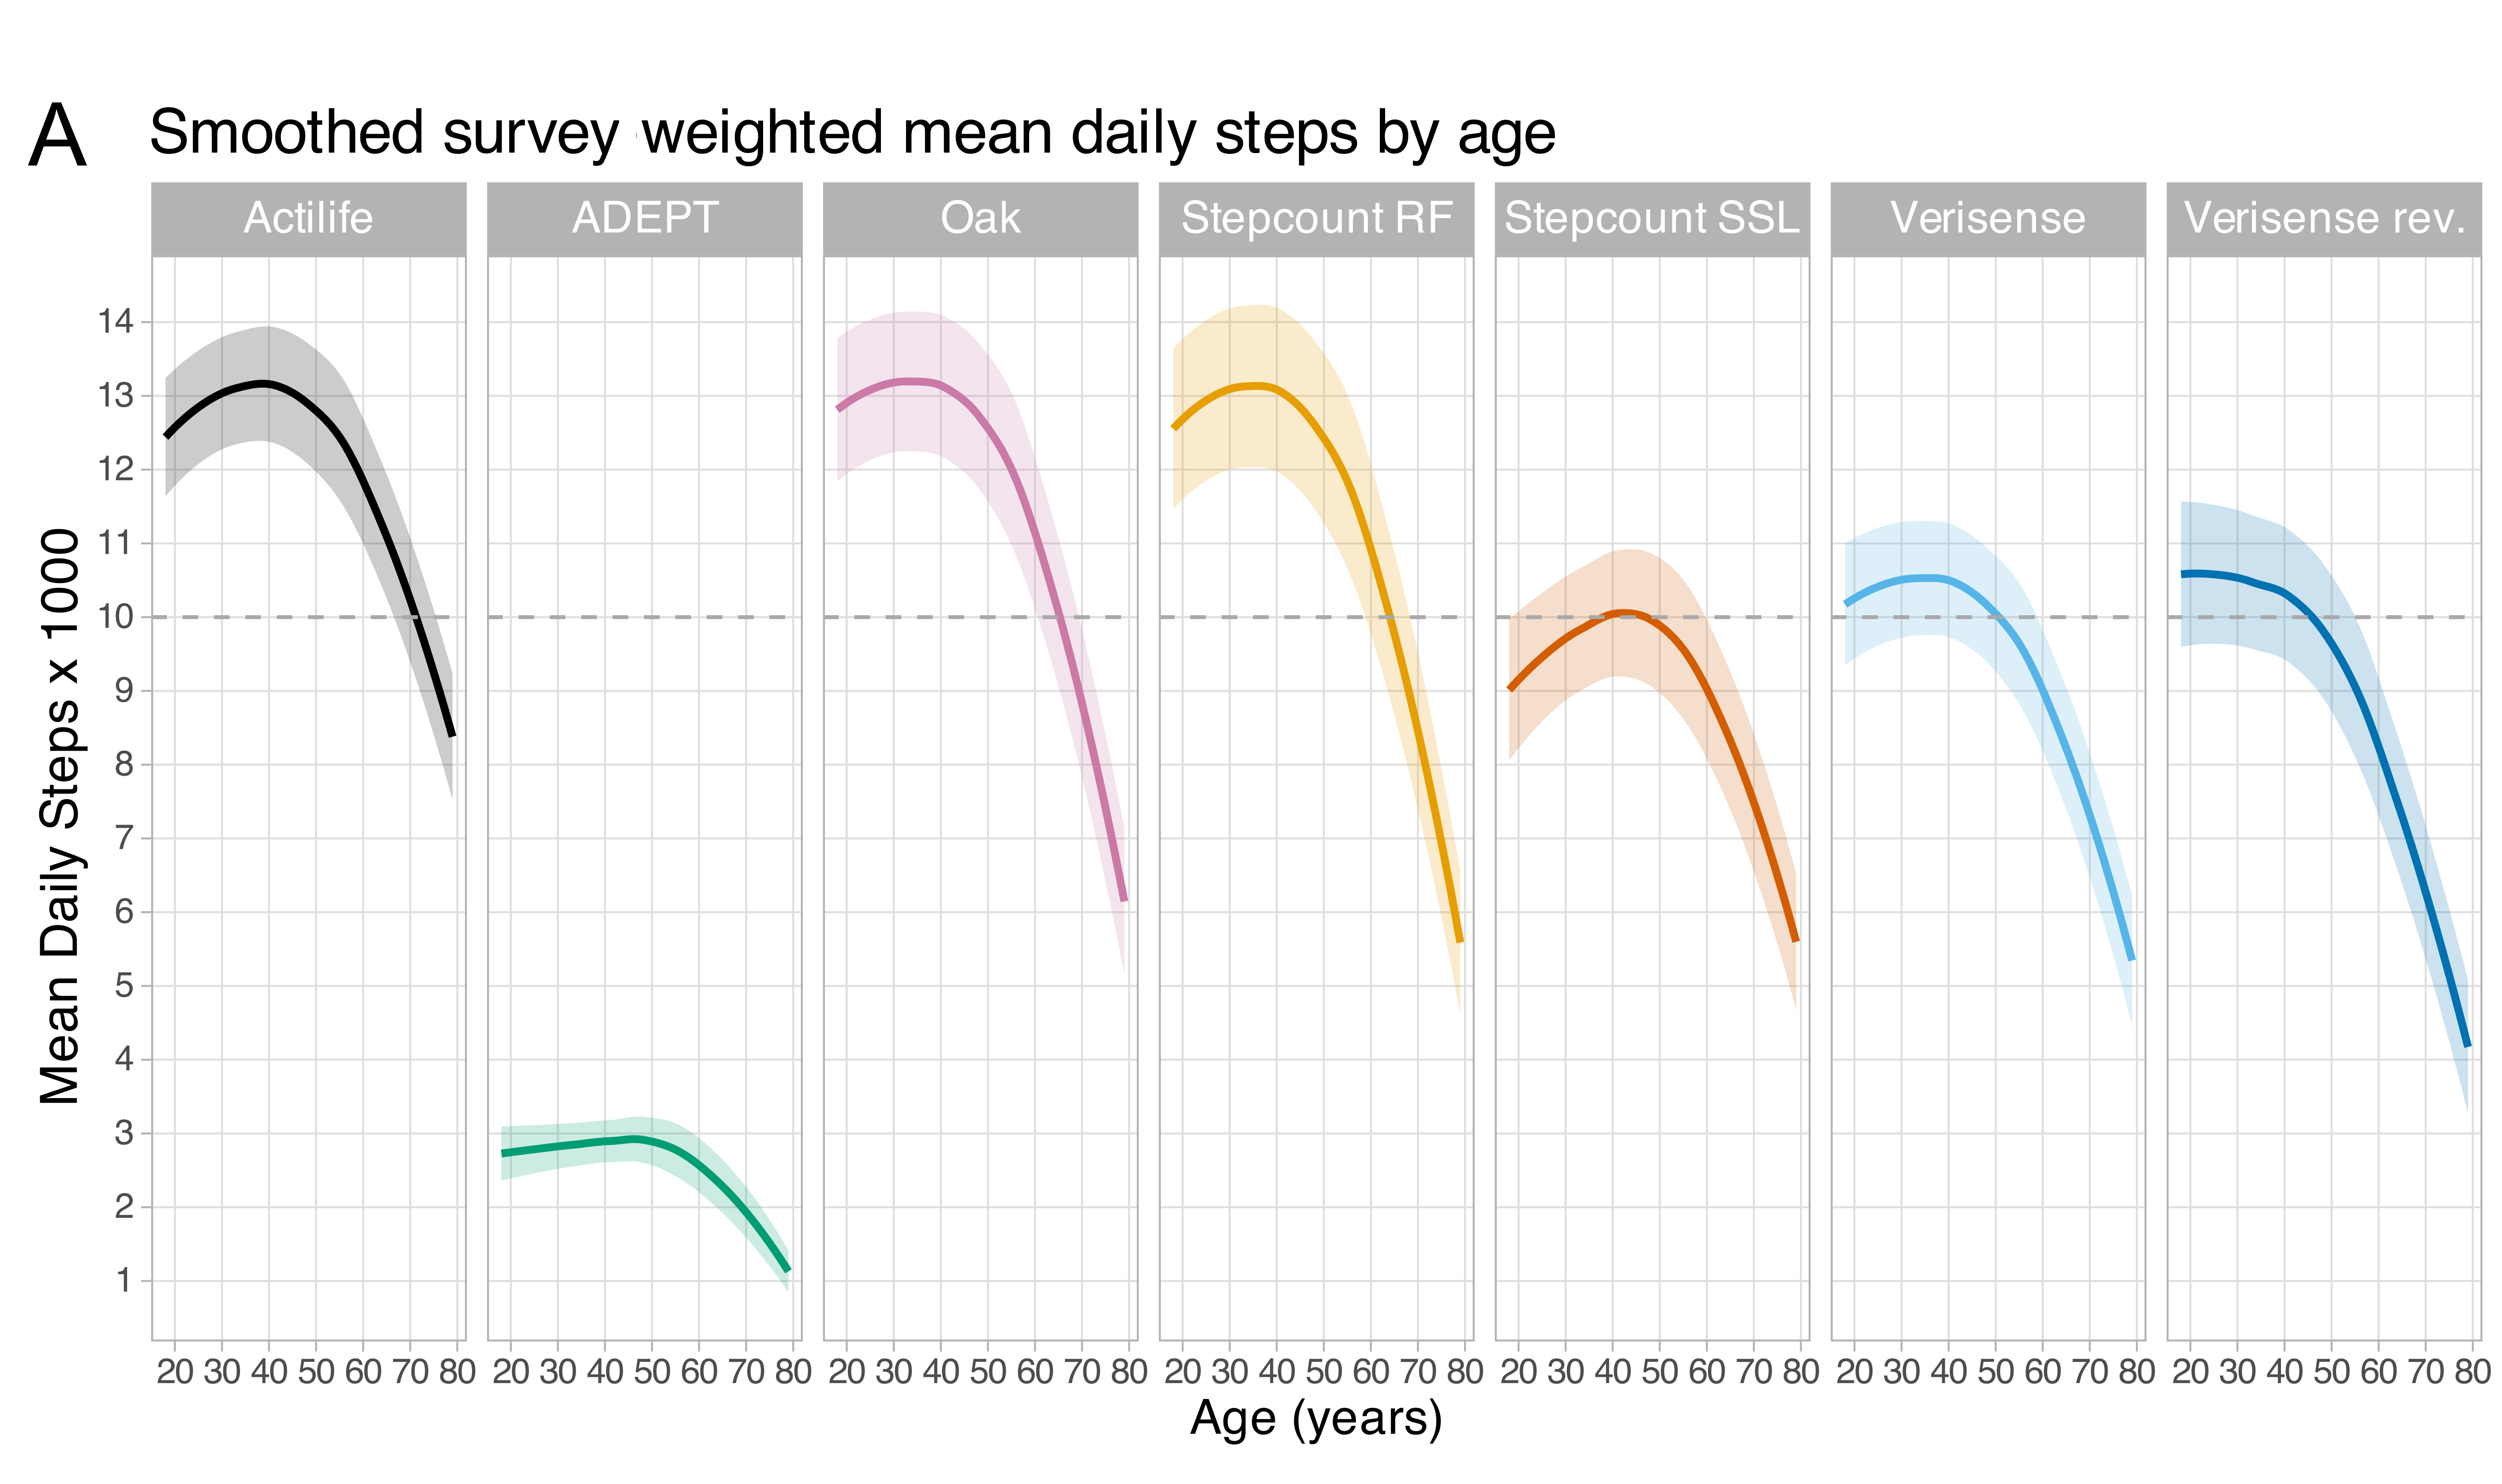
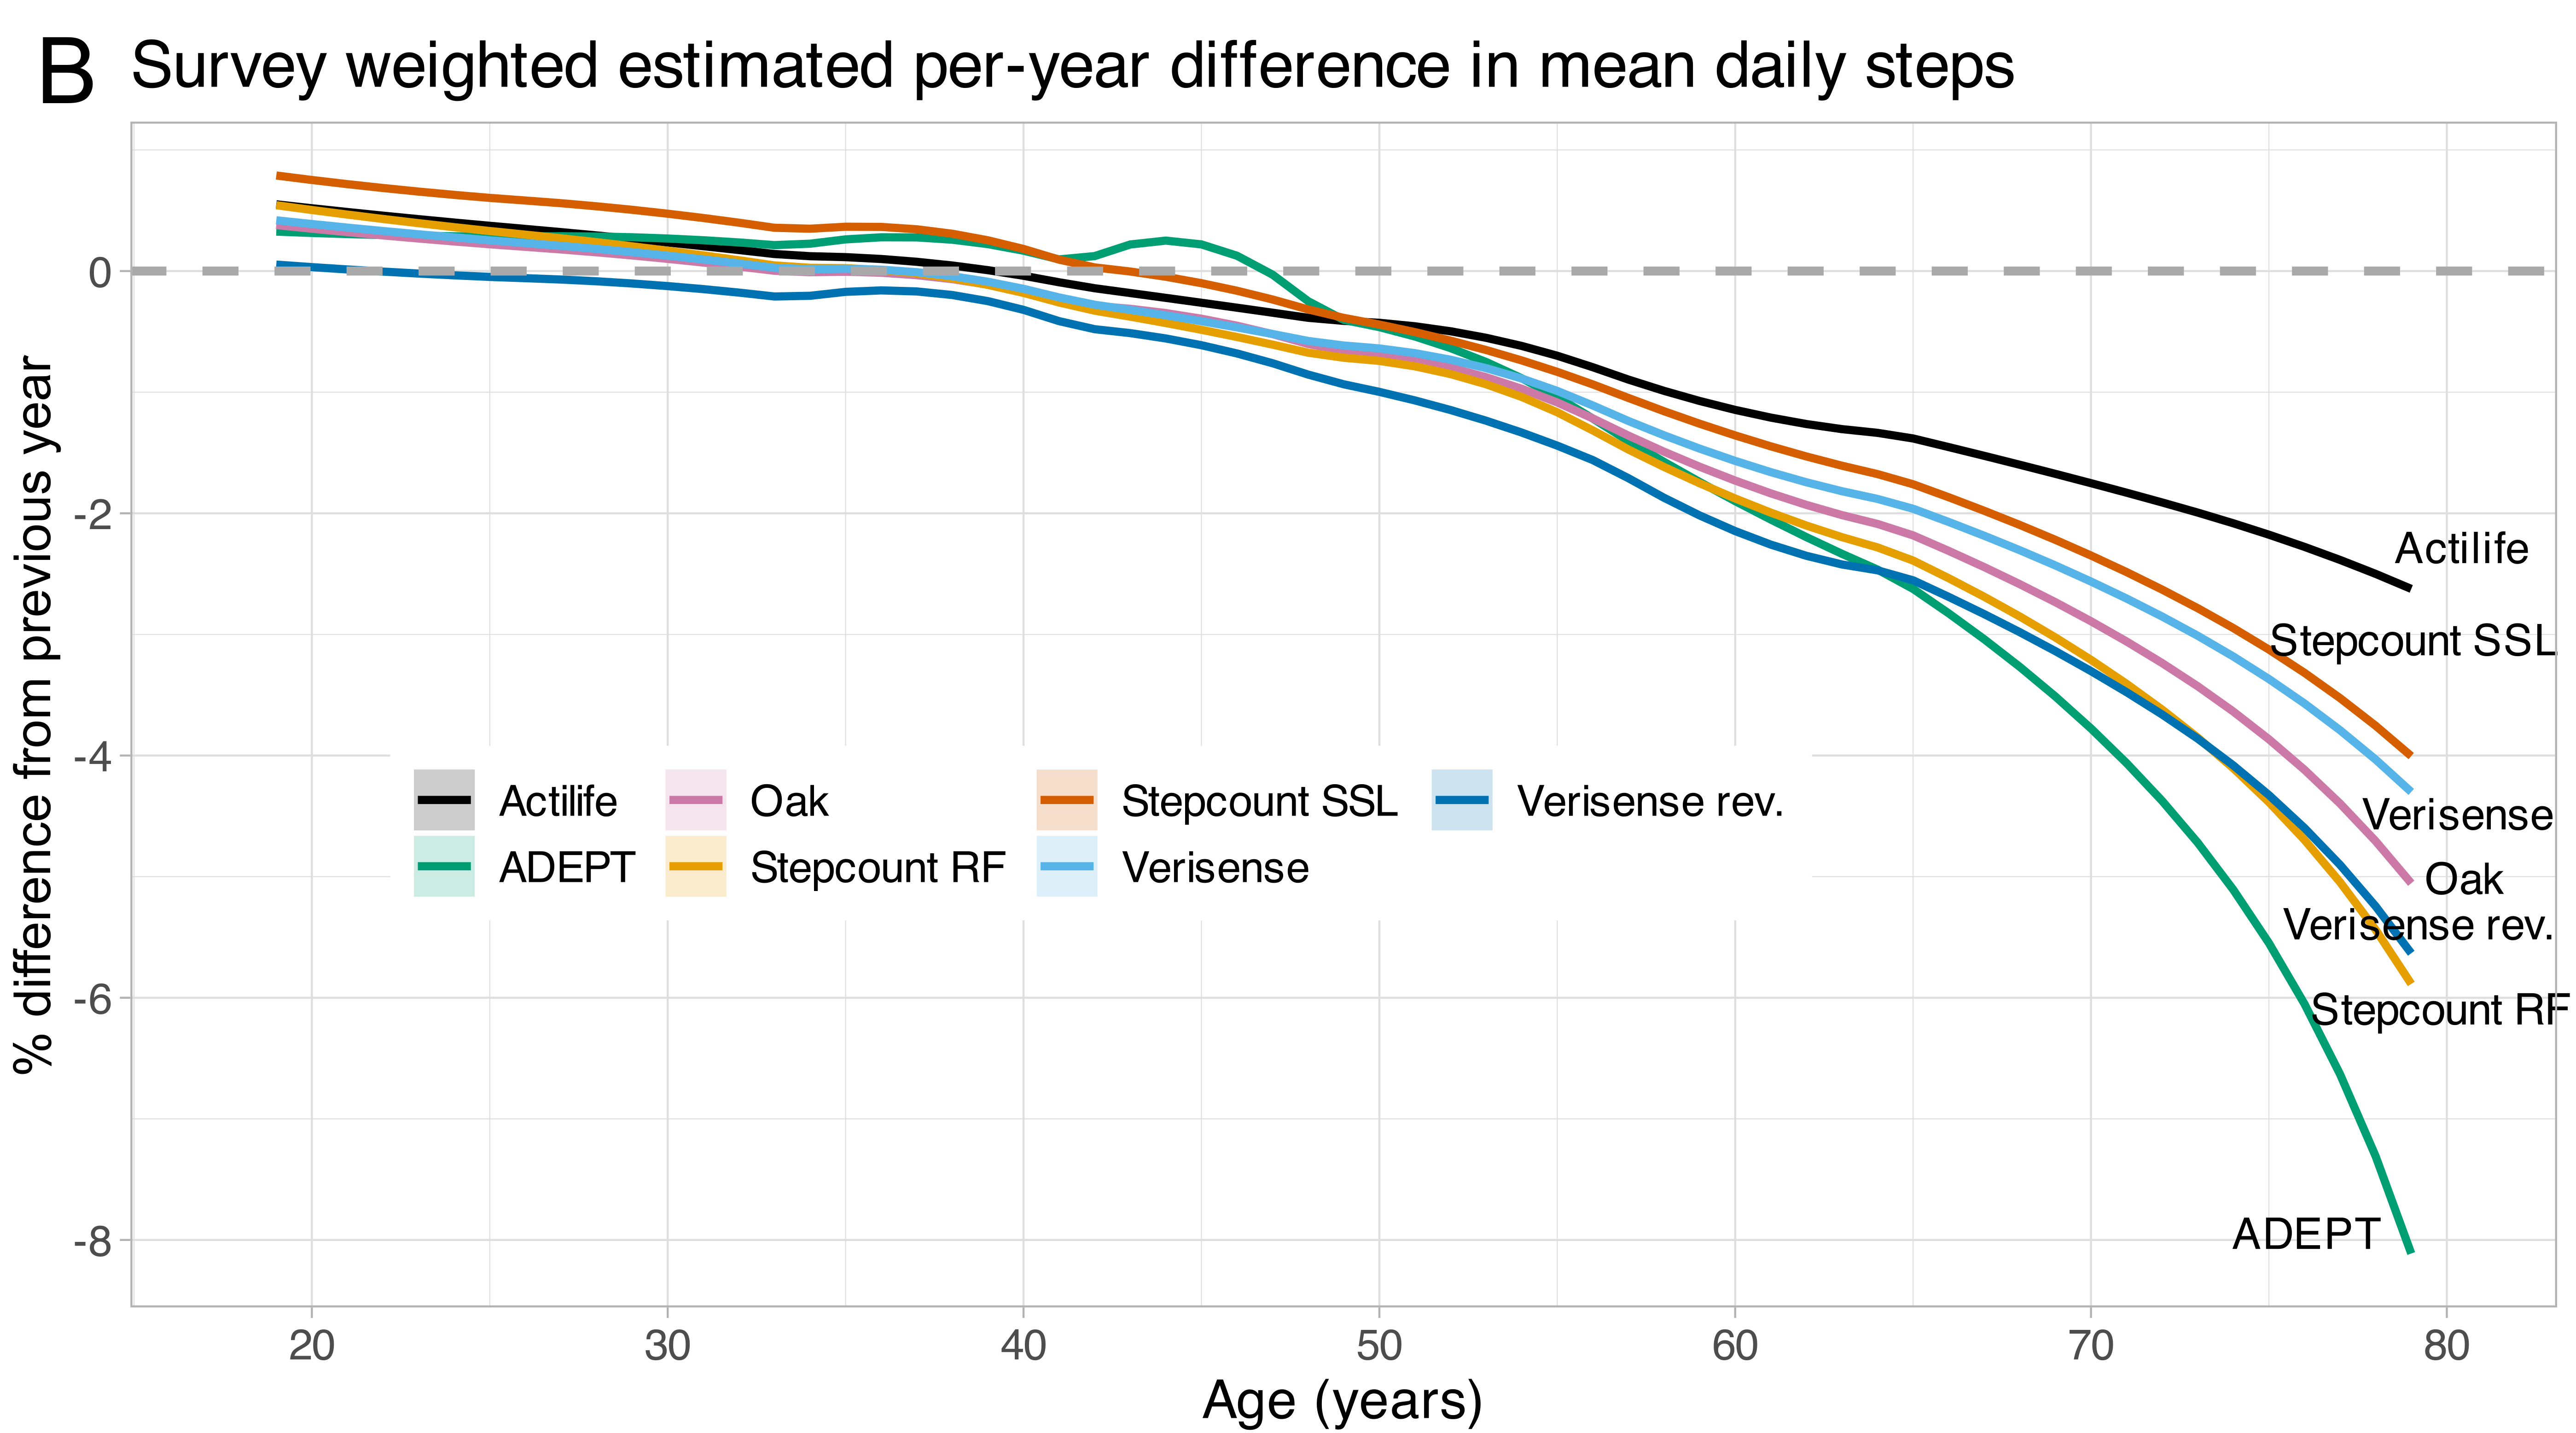
Apply to NHANES
Fairly high correlation between methods

Apply to NHANES
And more predictive of 5-year mortality (even than AC/MIMS)

Apply to NHANES
Dose response relationship between steps and mortality

Data Available for Use - PhysioNet
The data is available (more derivatives to come):
https://physionet.org/content/minute-level-step-count-nhanes/1.0.0/
https://physionet.org/static/published-projects/minute-level-step-count-nhanes/1.0.0/

What about a Disease Group (e.g. Parkinson’s)
https://doi.org/10.3390/ijerph18168596
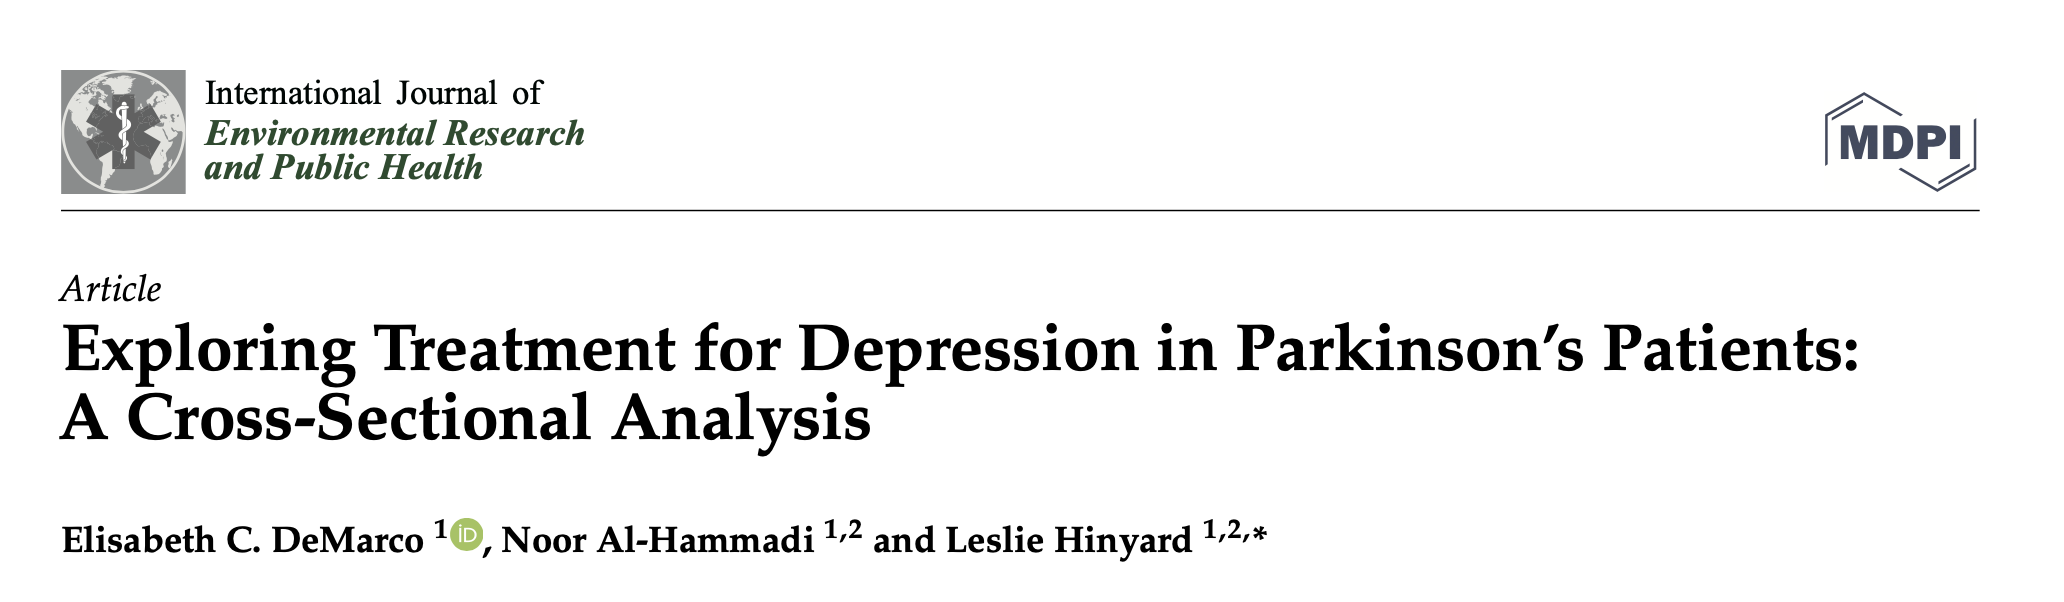
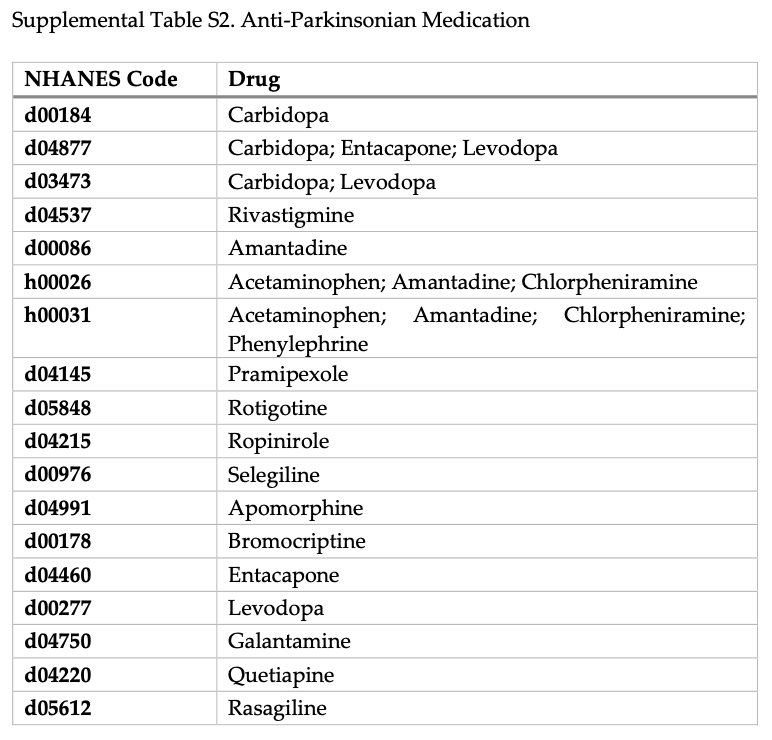
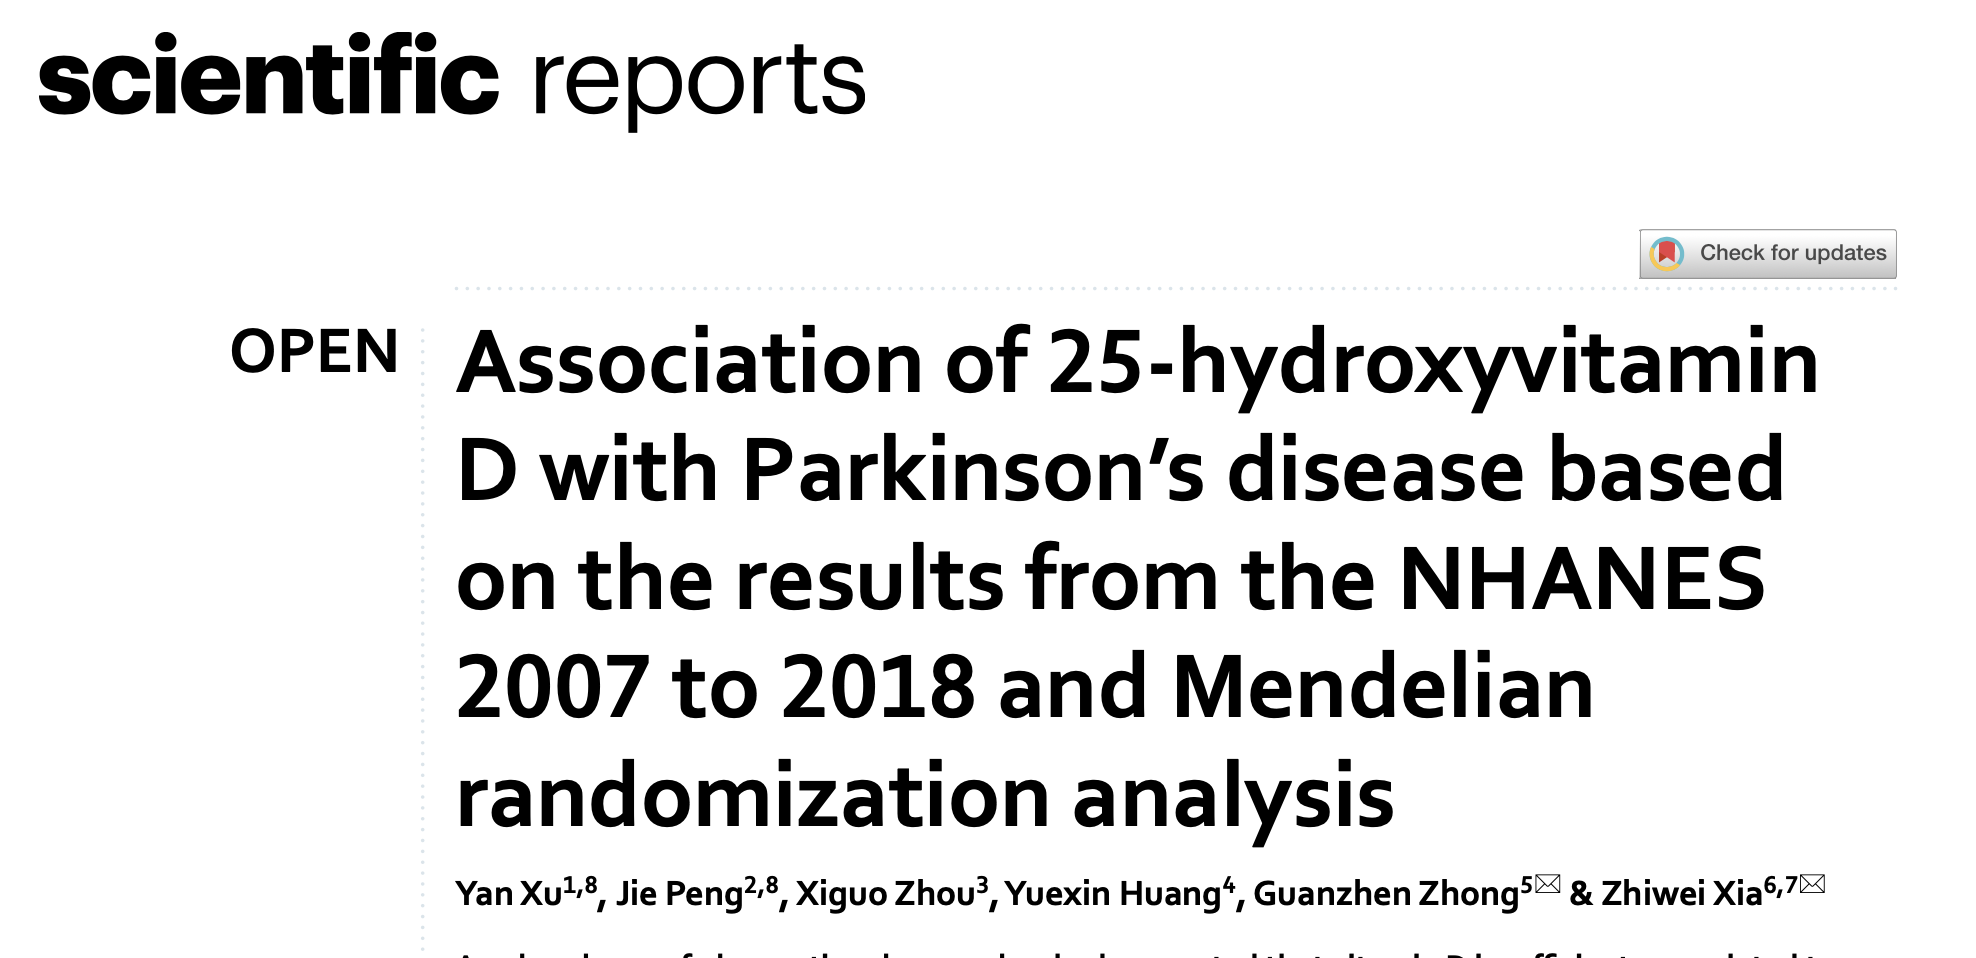
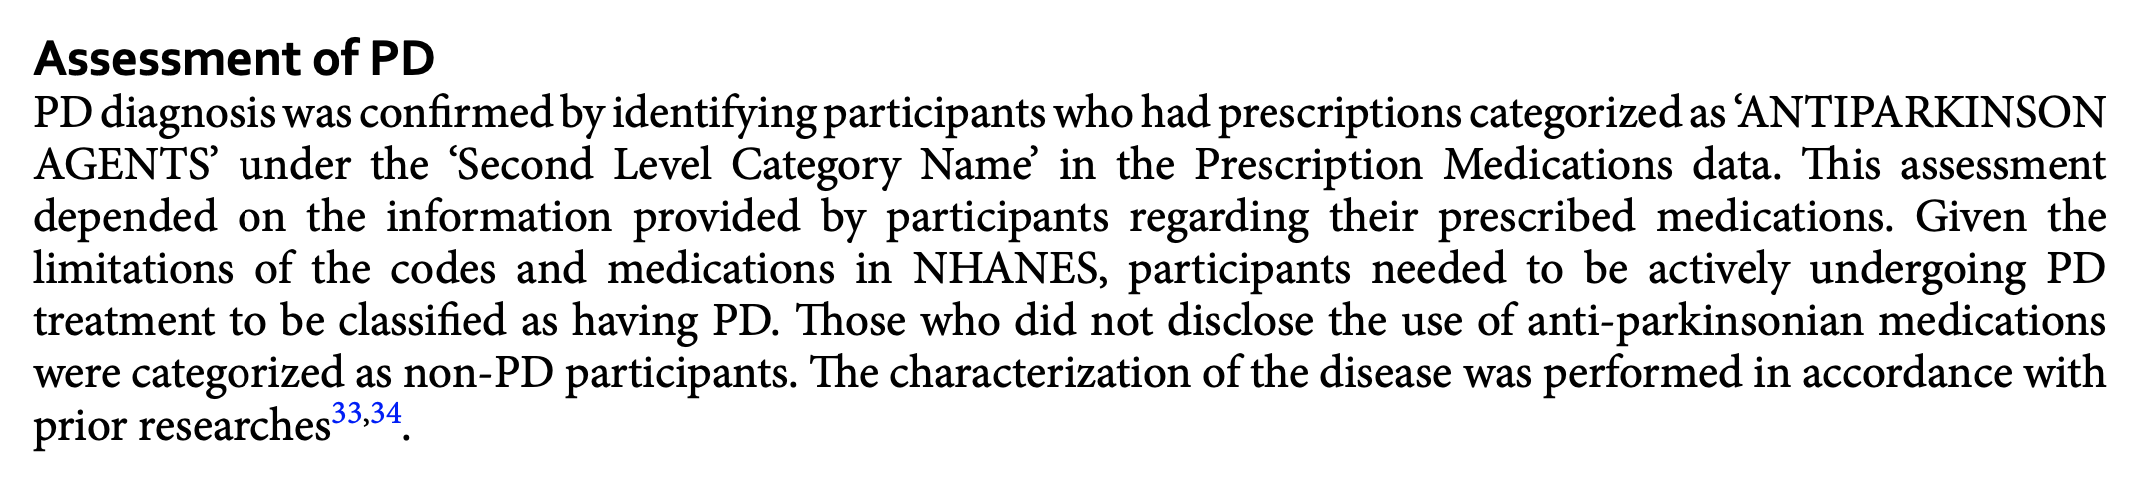
https://doi.org/10.1038/s41598-025-87120-6 and https://doi.org/10.3390/jpm10030069
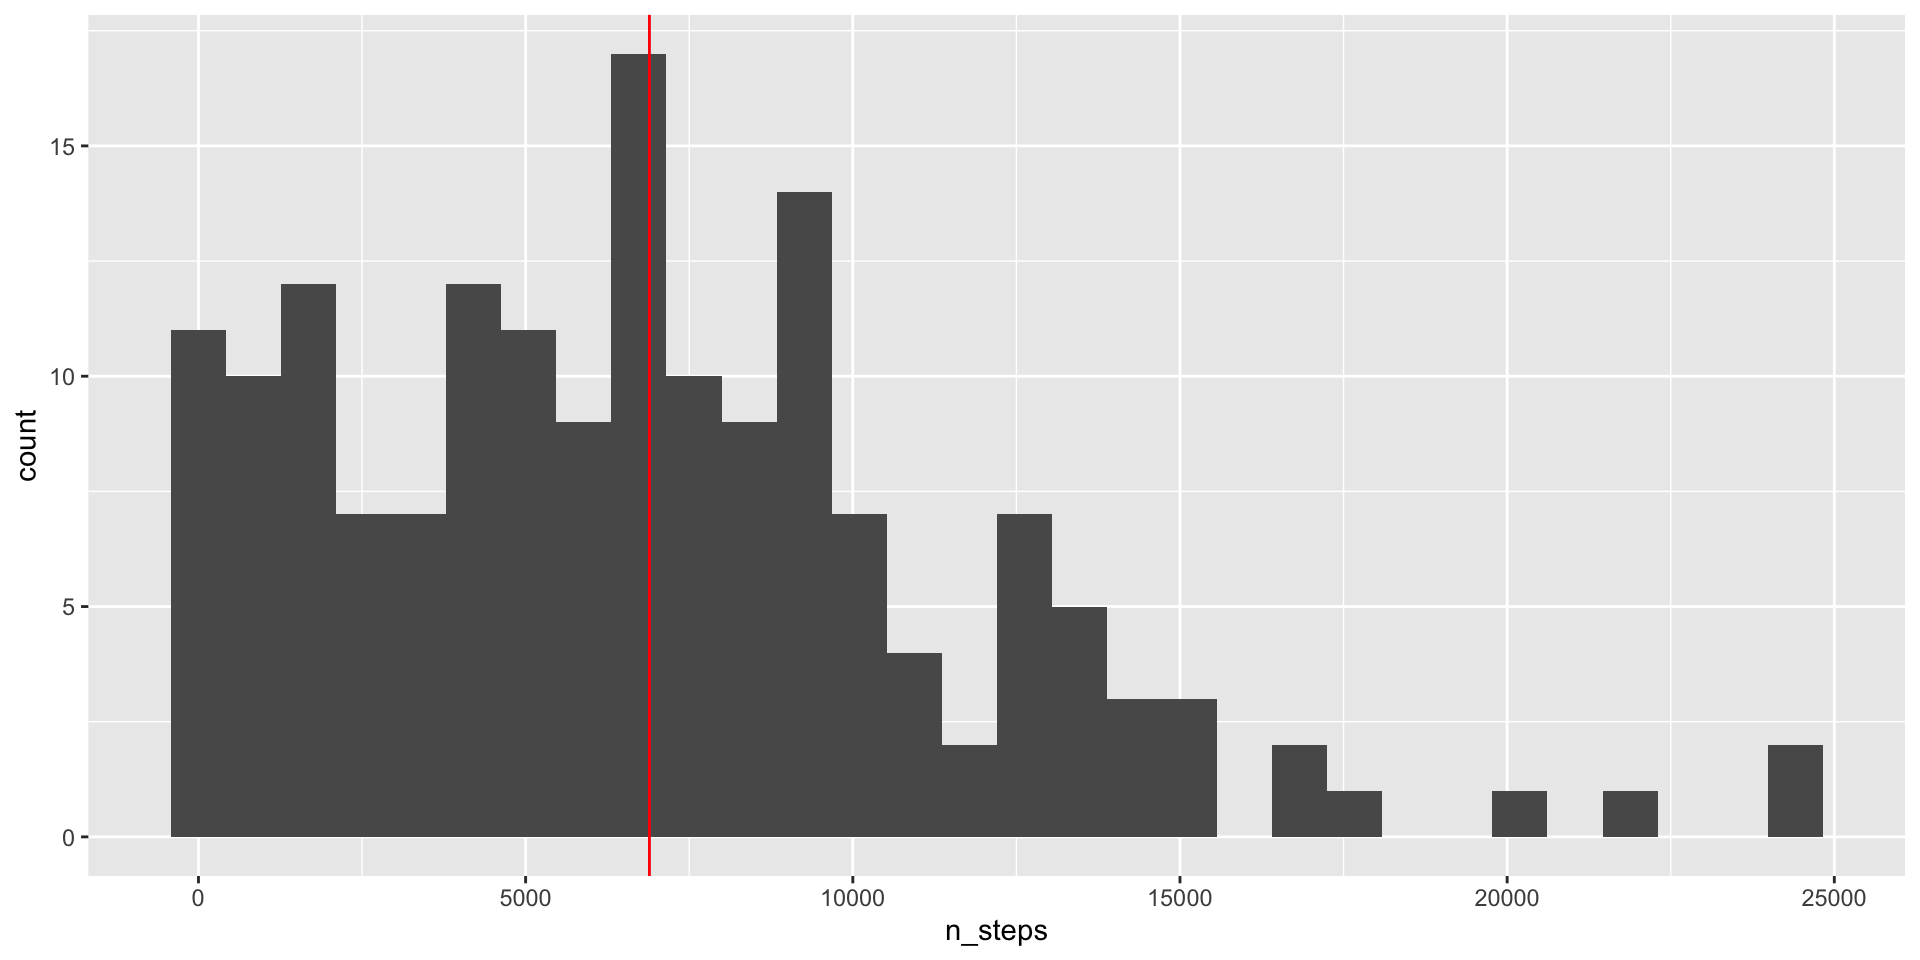
Mean Number of Steps per Day for PD
Here is the distribution of mean steps/day with good minute filter for PD (mean in red):
References


John, Dinesh, Qu Tang, Fahd Albinali, and Stephen Intille. 2019. “An Open-Source Monitor-Independent Movement Summary for Accelerometer Data Processing.” Journal for the Measurement of Physical Behaviour 2 (4): 268–81.
Karas, Marta, John Muschelli, Andrew Leroux, Jacek K Urbanek, Amal A Wanigatunga, Jiawei Bai, Ciprian M Crainiceanu, and Jennifer A Schrack. 2022. “Comparison of Accelerometry-Based Measures of Physical Activity: Retrospective Observational Data Analysis Study.” JMIR mHealth and uHealth 10 (7): e38077.
Khandelwal, Siddhartha, and Nicholas Wickström. 2017. “Evaluation of the Performance of Accelerometer-Based Gait Event Detection Algorithms in Different Real-World Scenarios Using the MAREA Gait Database.” Gait & Posture 51 (January): 84–90. https://doi.org/10.1016/j.gaitpost.2016.09.023.
Koffman, L, C Crainiceanu, and J Muschelli. 2024. “Comparing Step Counting Algorithms for High-Resolution Wrist Accelerometry Data in NHANES 2011-2014.” Medicine & Science in Sports & Exercise. https://doi.org/10.1249/MSS.0000000000003616.
Koffman, Lily, and John Muschelli. 2024. “Evaluating Step Counting Algorithms on Subsecond Wrist-Worn Accelerometry: A Comparison Using Publicly Available Data Sets.” Journal for the Measurement of Physical Behaviour 7 (1).
Koffman, Lily, Yan Zhang, Jaroslaw Harezlak, Ciprian Crainiceanu, and Andrew Leroux. 2023. “Fingerprinting Walking Using Wrist-Worn Accelerometers.” Gait & Posture 103: 92–98.
Mattfeld, Ryan, Elliot Jesch, and Adam Hoover. 2017. “A New Dataset for Evaluating Pedometer Performance.” In 2017 IEEE International Conference on Bioinformatics and Biomedicine (BIBM), 865–69. Kansas City, MO: IEEE. https://doi.org/10.1109/BIBM.2017.8217769.
Neishabouri, Ali, Joe Nguyen, John Samuelsson, Tyler Guthrie, Matt Biggs, Jeremy Wyatt, Doug Cross, et al. 2022. “Quantification of Acceleration as Activity Counts in ActiGraph Wearable.” Scientific Reports 12 (1): 11958.
Small, S R, L von Fritsch, A Doherty, S Khalid, and A Price. 2022. “OxWalk: Wrist and Hip-Based Activity Tracker Dataset for Free-Living Step Detection and Gait Recognition.” University of Oxford.
Small, Scott R, Shing Chan, Rosemary Walmsley, Lennart von Fritsch, Aidan Acquah, Gert Mertes, Benjamin G Feakins, et al. 2024. “Self-Supervised Machine Learning to Characterize Step Counts from Wrist-Worn Accelerometers in the UK Biobank.” Medicine and Science in Sports and Exercise 56 (10): 1945.