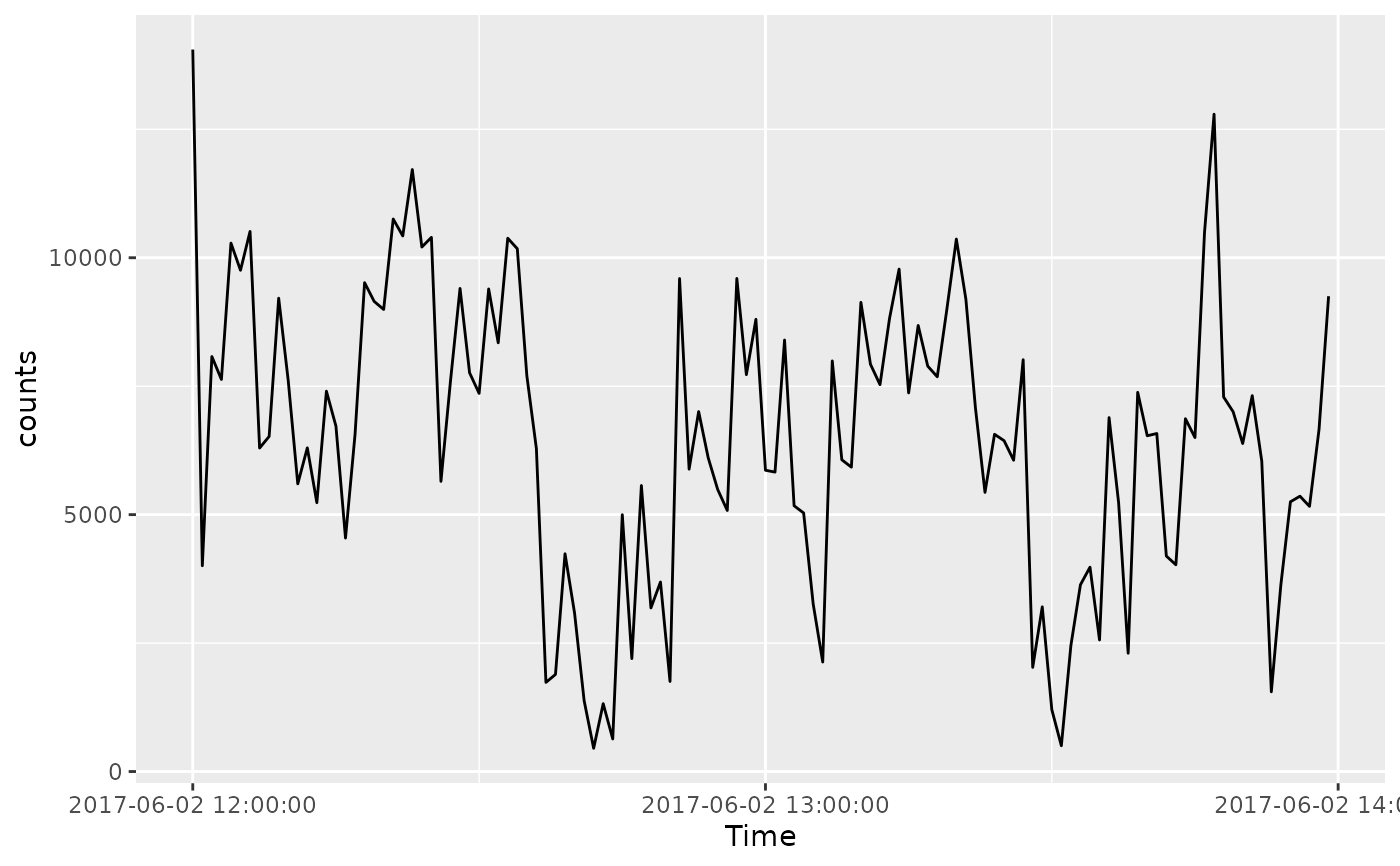
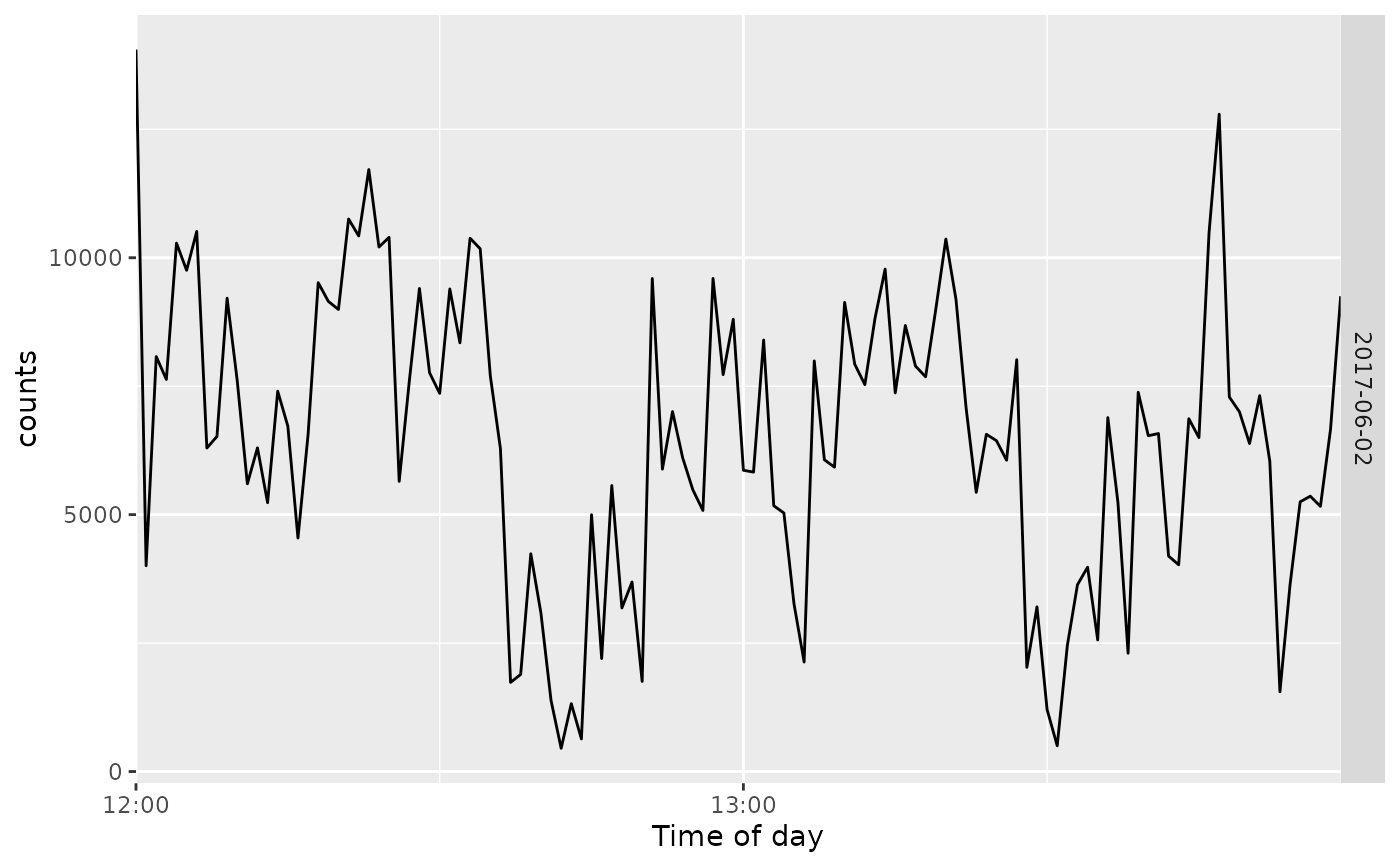
acti_plot_time() draws a time-series plot for a minute-level activity
measure, such as steps or activity counts. acti_plot_day() aligns the data
by time of day and places each date in its own facet row.
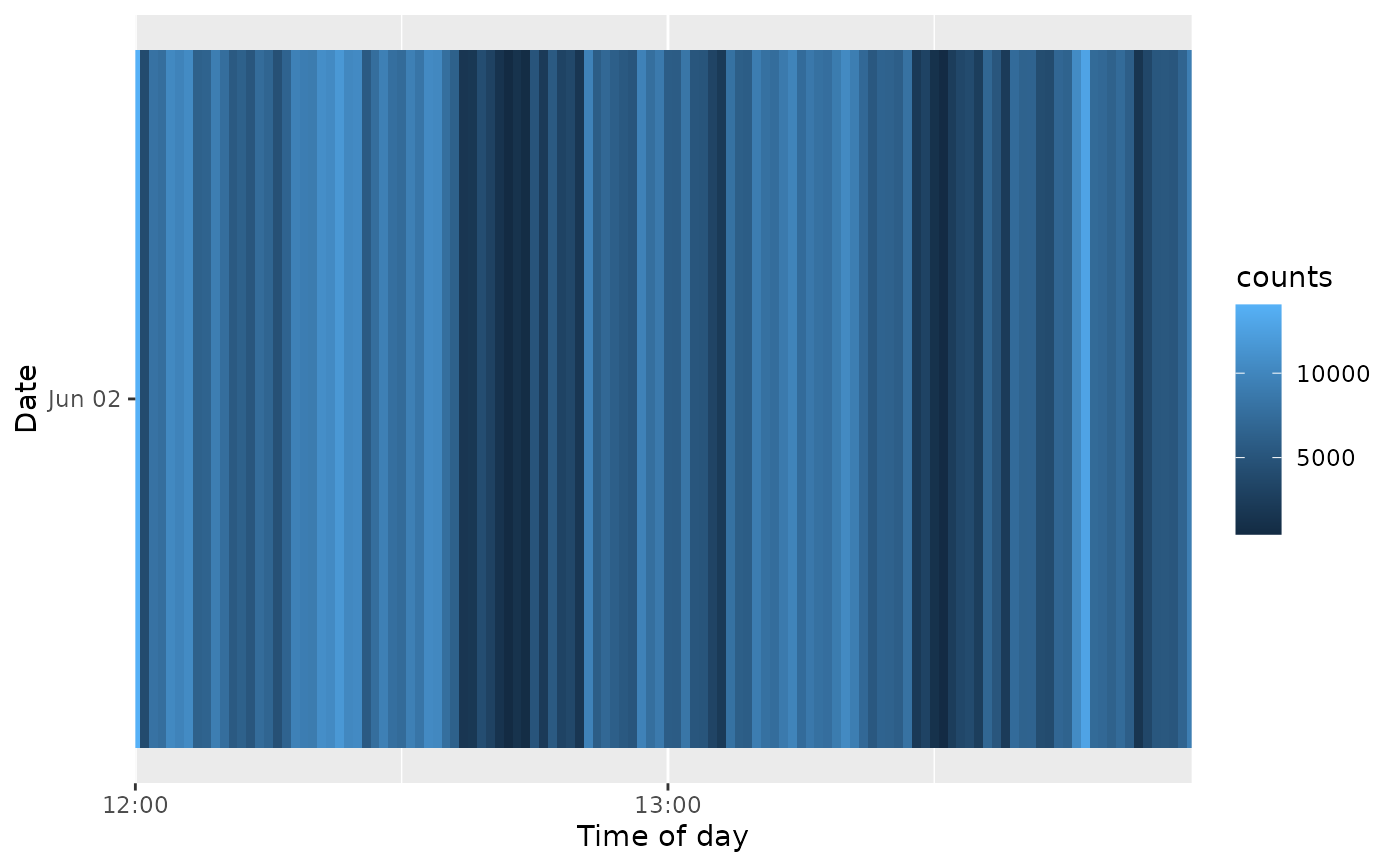
acti_plot_heatmap() provides the same date-by-time layout as a heat map.
Usage
acti_plot_time(
  data,
  value,
  time = time,
  breaks = NULL,
  connector = c("linear", "step", "line"),
  x_axis = c("default", "12 hours", "midnight"),
  ...
)

acti_plot_day(
  data,
  value,
  time = time,
  breaks = "4 hours",
  connector = c("linear", "step", "line"),
  facet = c("date", "month-day", "day"),
  ...
)

acti_plot_heatmap(data, value, time = time, breaks = "4 hours", ...)
Arguments
- data
A data frame containing a timestamp and an activity measure.
- value
The activity-measure column, supplied unquoted or as a string. For example,
stepsor"counts".- time
The timestamp column, supplied unquoted or as a string. It is
timeby default.- breaks
A single duration such as
"1 hour","4 hours", or"15 mins". It controls x-axis spacing. UseNULLfor ggplot2's default on the full-time plot or no specified breaks on aligned plots.- connector
Should a
geom_step(step) orgeom_line(linear/line) be used to connect points?- x_axis
The x-axis labelling scheme for
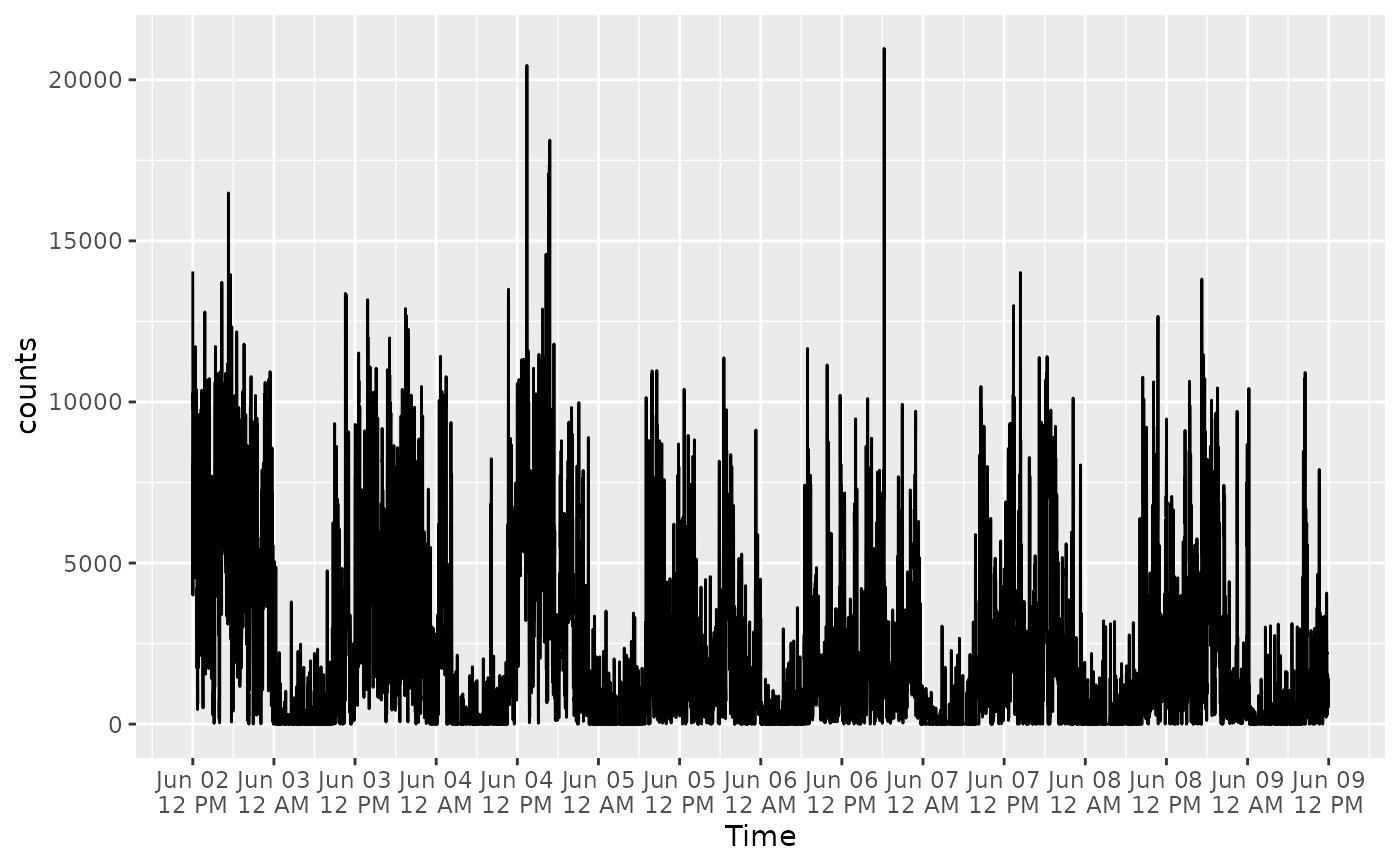
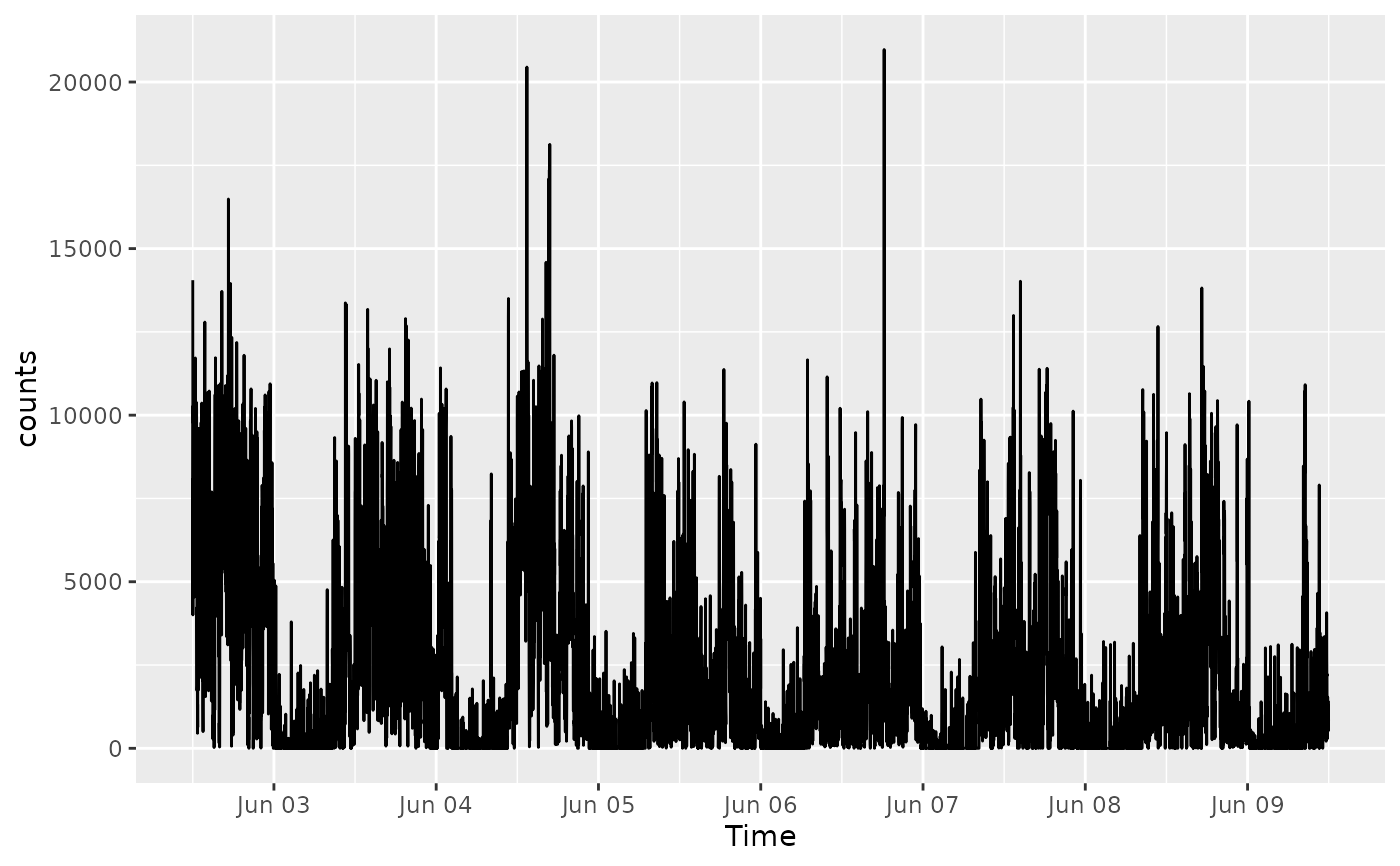
acti_plot_time(). Use"default"to usebreaksorggplot2's default;"12 hours"to show a date and 12-hour clock label every 12 hours; or"midnight"to label each date only at midnight. The latter two options set their own breaks.- ...
Additional arguments passed to the primary geom.
- facet
The facet labels for
acti_plot_day():"date"for the full date,"month-day"for a date without the year, or"day"for days since the first recording day (as calculated byactibase::acti_separate_times()).
Details
Data are prepared with actibase::acti_separate_times(), which recognizes
the timestamp conventions used by activerse packages and adds date and
time-of-day variables.
Examples
# The first two hours of the packaged minute-level data.
activity <- acti_minute_data[seq_len(120), ]
acti_plot_time(activity, counts, breaks = "1 hour")
 acti_plot_time(acti_minute_data, counts, x_axis = "12 hours")
 acti_plot_time(acti_minute_data, counts, x_axis = "midnight")
 acti_plot_day(activity, "counts", breaks = "1 hour")
 acti_plot_heatmap(activity, counts, breaks = "1 hour")